How would you plan a reunion?

How would you plan a reunion with a bunch of people you're terribly fond of, many of whom you've never met face-to-face, who you touch base with only occasionally and live in places scattered across the globe?


A few years back I lead a group of about 120 teachers in a year long immersive professional development experience around leveraging modern technologies to foster deep student learning. This was for Will & Sheryl's Powerful Learning Practice in their 2nd year of operation.


We did some cool stuff together. Stuff like this game of Presentation Tennis:


That grew grew out of a Digital Field Trip we did into Flickr. Here's the group where we shared our pictures:


Flickr was a great introduction to all sorts of ideas: social networking, learning through play, tagging, visual thinking, rss, collaborative learning, portable content, and more. Most importantly it was a way for us to connect personally. We saw where and how we lived and worked. We saw summer while some of were in the middle of winter. We saw little glimpses of each other's lives while we learned and played together. Bonds began to form.


Cary was looking through our photo pool when she tweeted:


So was born this little online reunion. We'll try to share a photo-a-day for as long as we can make it. If it goes all year great. If not that's good too. No rules. If you miss a day no problem; just pick it up again the next day.


We'll share our pics in our old flickr group and if you weren't part of the original group feel free to jump in nonetheless. Let's all tag our pictures: "intplpreunion12". They'll aggregate below ...


I plan to also add my pics to the 2012/366photos group.

How would you plan a reunion?

How would you plan a reunion with a bunch of people you're terribly fond of, many of whom you've never met face-to-face, who you touch base with only occasionally and live in places scattered across the globe?


A few years back I lead a group of about 120 teachers in a year long immersive professional development experience around leveraging modern technologies to foster deep student learning. This was for Will & Sheryl's Powerful Learning Practice in their 2nd year of operation.


We did some cool stuff together. Stuff like this game of Presentation Tennis:


That grew grew out of a Digital Field Trip we did into Flickr. Here's the group where we shared our pictures:


Flickr was a great introduction to all sorts of ideas: social networking, learning through play, tagging, visual thinking, rss, collaborative learning, portable content, and more. Most importantly it was a way for us to connect personally. We saw where and how we lived and worked. We saw summer while some of were in the middle of winter. We saw little glimpses of each other's lives while we learned and played together. Bonds began to form.


Cary was looking through our photo pool when she tweeted:


So was born this little online reunion. We'll try to share a photo-a-day for as long as we can make it. If it goes all year great. If not that's good too. No rules. If you miss a day no problem; just pick it up again the next day.


We'll share our pics in our old flickr group and if you weren't part of the original group feel free to jump in nonetheless. Let's all tag our pictures: "intplpreunion12". They'll aggregate below ...


I plan to also add my pics to the 2012/366photos group.

Seeing Differently or 31 Days in October

It seems I've been talking about flickr a lot lately. Mostly in the course of discussing pedagogy and Brain Rule #10 in the context of my flickr assignment. One of the points I often bring up is the experiment I did with myself, inspired by folks who, like D'Arcy, are taking a photo a day. Every day. All year.


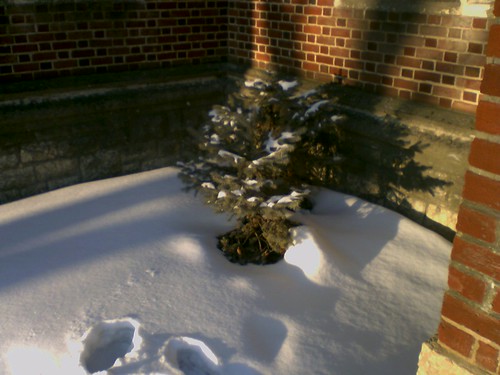
I just don't have that kind of stamina. I've twice in the past managed to sustain it for about a month; 31 Days. Every time the experience has changed the way I see the world around me. I notice things I've missed even though I walk past them every day; like that little tree ... I never noticed it until I started taking a picture a day for the 31 days of March, 2008.


This is what happened in October of last year when I did this again with a larger group of teachers from around the world:


Anyway, I'm starting this up again and you're invited along for the ride. I've already heard from a couple of Manitoba educators who are interested in doing this and some folks from MICDS in St. Louis might join in the fun too; they might even have a few students join us ... I really like that idea.


I'm going to tag all my photos 31DaysOct09. Feel free to use the same tag. Tagging all your photos allows you to create nifty little slideshows of them like the one I have above. Even if you use the same tag as me you can pull out just your photos if you want to create your own slideshow.


If you'd like to join, with or without your students, you can sign up for the flickr group I started. We're starting tomorrow, October 1st. If you start late, that's OK too. There are no rules. We're just going to have fun ... and maybe start seeing things differently together.


Photo Credit: Snow Came Back This Morning by flickr user dkuropatwa

How Flickr Threw a Switch In My Head

Last year, one of the people in my aggregator, D'Arcy Norman, published a video to share the results of his year long experiment: he took a picture every day for a year and published it to his flickr account. He called the experiment 365 Photos. Actually, an entire community has grown up around this idea on flickr; it wasn't D'Arcy's idea originally, there are over 1200 "365 Days" groups. I don't know who started this originally but it seems like a natural extension of publicly sharing your photos.


D'Arcy said a switch got thrown in his head. Watch his video of the results; as you watch you'll get a sense of what his year was like, when and where he went on vacation, his love for his son, the things he finds interesting, but pay particular attention to how he uses perspective, how sets up his "shots", and the things in his world he notices:


As the new year rang in for 2008 several other people in my aggregator decided to join D'Arcy in his new experiment: 366 Photos (2008 is a leap year). After several weeks many started writing about how their visual perception changed as a result of doing this. They started noticing things they hadn't before, the quality of the photos they took (of things, family, friends, events, etc.) improved dramatically, and a switch in their heads flickred.


I came late to this party for a number of reasons, not the least of which is that the "every day for a year" commitment intimidates me. So, in March I started my own experiment: 31 Days.


There's a bit of folk wisdom that says it variously takes 21 or 28 days to create (or break) a habit. (15 minutes a day every day. If you miss a day just keep going until you get to 21 — or 28 — days in a row.) I've been able to find no verifiable research to back this up so make of it what you will. In any case, I did find that my 31 Days experiment lead to a change in the way I see the world and use visual imagery in my teaching.


Now, this part wasn't planned, but as I've used flickr more and more I've become more and more interested in taking "interesting" pictures.


As a math teacher I was fascinated to discover that photographers have long known of and used a mathematical definition for beauty. It's based on the number φ, phi (one H of a lot cooler than π, as my students say), which it turns out is embedded in the the natural world in all sorts of ways including the various dimensions of our own bodies. I digress, that's a post for another time. ;-)


I stumbled upon an online photography course over at morgueFile.com. I've only read through Lesson 1: Composition And Impact - It's A Beautiful Photograph, But Do You Know WHY It's Beautiful?. It had a significant impact on how I take pictures and view the world. That was almost a year ago. I'm about ready to move on to Lesson 2: Aperture And Shutter Speed - How They Work Together.


Here's how I did my 31 Days experiment:


 » All pictures were taken with my cell phone. (Because it's always there, and it's easy.)


 » All pictures were uploaded to flickr (almost) daily. (You can send directly from your phone if you like.)


 » All pictures were tagged with a unique tag for the experiment. i.e. 31Days.


 » All pictures were aggregated on my blog using a slideshow tool, SlideFlickr.com (also allows you to embed music).


 » I took at least one picture every day. (Some days I took more and picked the one liked best.)


You might wonder: Why all this photography stuff from a math teacher? Well, the short answer is that I wanted to model what I asked my students to do — check out the flickr assignment I designed.


The long answer is: It has enriched my life. I used to leave taking pictures to others; my wife or mother-in-law. Now I take more pictures than anyone, and the skills I've developed have lead to some striking pictures of my kids (sorry, we don't publish publics pics of our kids online ... yet). More than that, it has effected the way I read to learn. I recently finished reading John Dewey's Experience and Education. I decided, as a mnemonic and a way to help me move everything I read into long term memory swiftly, I would mentally construct an image that summarizes the content of each chapter. I hope to publish it as a slidecast (slideshow + podcast) on Slideshare in the near future. I know that little book really well as a result of doing this. Creating the slidecast will really embed it in my brain.


Anyway, I think I'm ready to try this experiment again in October. October in Winnipeg starts with colourful leaves on the trees and ends with snow on the ground. This is going to be fun!


Photo Credits:


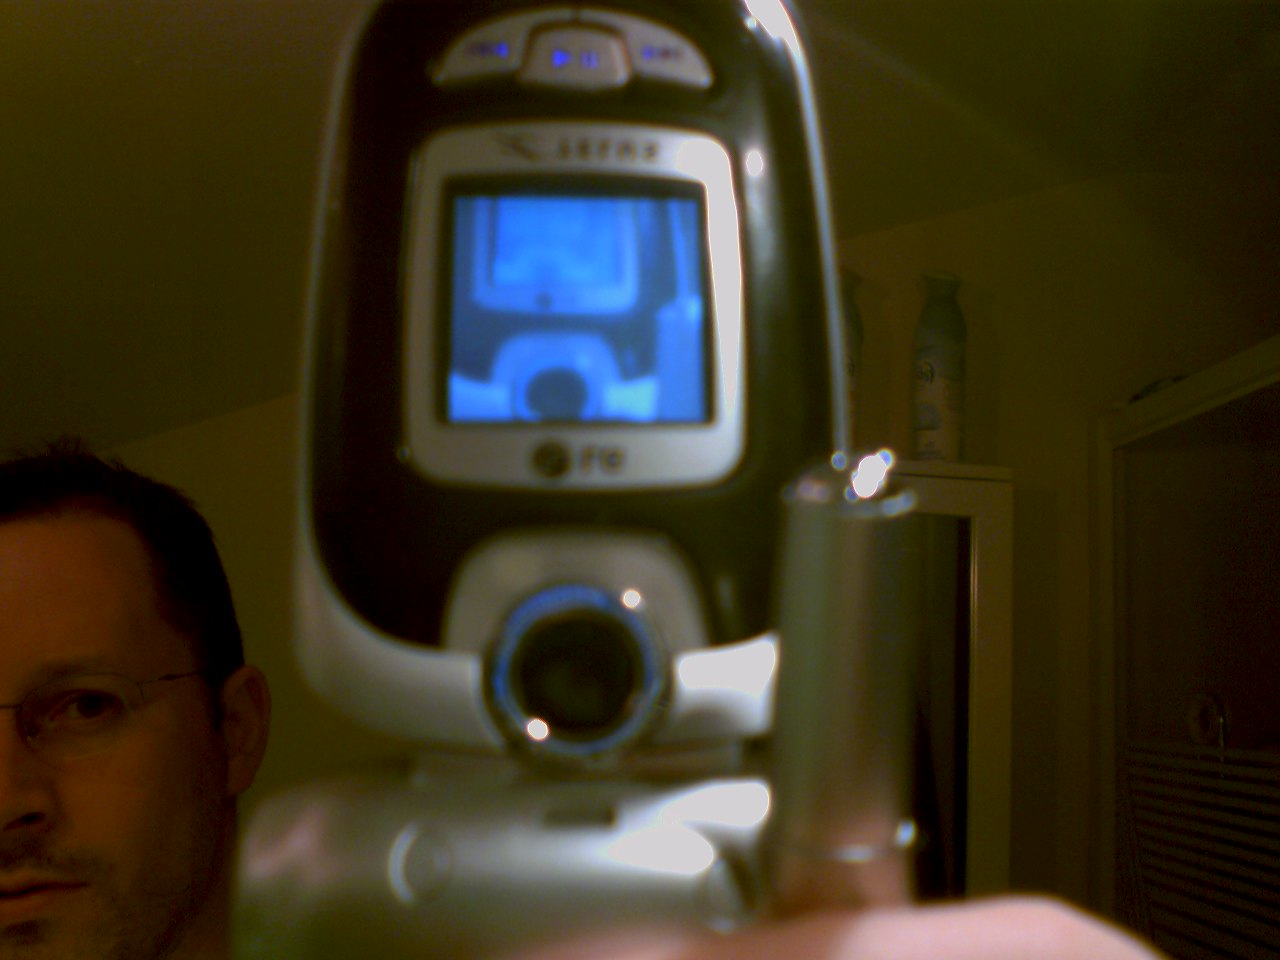
Me and my Cell by flickr user dkuropatwa


Vitruvian Genesis by flickr user karlequin

31 Days


Working online has made me more digitally literate. More than that, as I share what I've learned with others in various workshops and presentations I've been struck how my thinking about teaching has evolved to include a storytelling element and become more and more visually based. I've begun to think differently. flickr is the place I go looking for inspiration and metaphors to use in my classroom each day and in the presentations I give.


A number of people I know have taken D'Arcy Norman's lead and joined his 366 Days flickr group. Many report that after a while they experience a change in the way the view the world around them. I don't think I have the stamina to go 366 days (and I missed the start date for 2008) so I'm trying out my own experiment. One picture each day for the 31 days of March; taken with my cell phone. March is a month of dramatic change in the weather here in Winnipeg. We'll see how this plays out in my little experiment.


Also, my students have all begun their first flickr photo assignments for this semester. Since I'm asking them to look at their world differently I thought it only fair that I do something similar. I'm thinking my next photo experiment, in another month, might be to take a photo a day somehow connected to noticing the math in the world around me.


For now, here is the bucket full of photos I've taken so far. New pictures will be added daily and this slideshow will update itself automatically.


I wonder if 31 days is long enough for me to experience the change in visual perception I've heard others describe?

Pictobrowser

This is another test. Last year several of my students asked how they could embed flickr slideshows in their blog posts. This was dead simple and visually attractive. The photos are from my flickr account tagged summer07. They were taken in Squamish, Whistler, Mt. Hood, Seattle and Banff.


Click on the picture to advance the images or select one from the thumbnails below.


If you like this tool check out Pictobrowser.

Flickr Assignment Roundup

I spent the better part of December blogging about the flickr assignment I developed and the process and product of the rubric that we generated. It seems to have struck a chord with some folks as I continue to get email from people asking about the both the process and product.


Once again, accessing my "outboard brain" (this blog -- kudos again to Brian for that metaphor) I've compiled all the posts about the project here in the order that they were published.


See the end for an update on how the assignment has evolved since I last wrote about it.


This rubric was published to all the class blogs. I also gave each student a hard copy of the rubric. This hard copy doesn't have the links to examples that the online version does. It is also missing some descriptive text that is included in the online version.


Having the students assess their work and hand it in, I feel, made them more accountable for their grades. Some of them didn't do the assignment. They handed in a page today, with their name on it, that had only the words Level 0 circled.


Next semester I plan to do this assignment again. I will reopen the rubric to the new students for editing. They will benefit by at least having a more concrete set of guidelines to begin with.

Flickr Assignment Rubric v1.0 - We're Out of Beta!

Here is the rubric we've settled on together.


It's been an exhilarating experience watching the kids develop this. There were several points where Lani and I asked pointed questions about things that needed to be considered. Not everyone participated online. A few more participated in the class discussions we had. We never really got 100% of the students involved but those that did participate made excellent contributions to the document and the thinking behind it. It took me about an hour today to finally bring together everyone's ideas and edit the final version of the document below.


Looking back at the process and the thinking that went into it I find it interesting how the Hot Spot category earned the greatest attention and discussion. While there was some discussion about the mechanics of using hot spots (they shouldn't cover each other up) the better part of the conversations we had, and thinking we did, centered around how they can best be used to capitialize on their functionality. How the hot spots can best be used to connect with the mathematics these pictures are supposed to summarize.


The introduction to the rubric below was added last night as a footnote by one of the students summarizing their input on the document. Today the students in all my classes felt that it should be preserved. I suggested it become the overview of the assignment. We all agreed.


Anyway, here it is, version 1.0 fresh out of beta. ;-)


Flickr Assignment Rubric
It is paramount that the picture be in tune with the purpose of the assignment. It should show, first of all, the student's understanding of how the photo is related to mathematics. The hot spots are important too, because that's essentially your way of teaching other people. Creativity is a factor, because keeping one's interest in the photo contributes to the learning process. Finally, the picture quality should be kept in mind too. If we can't see the picture, it's going to be hard achieving all the other requirements.

Tags

The picture must be tagged properly with the course tag and assignment tag. If tags are misspelled or no tags are present the photo cannot be graded and will receive a grade of ZERO. Not tagging your photo properly and accurately is analogous to not handing in your work or not putting your name on it.


Classification
Mathematical Content (50%) Hot Spots (35%) Photograph (15%)
Level 4
Packed with mathematical concepts/facts. (Minimum 7 concepts/facts.) All hot spots accessible; i.e. "smaller" hot spots are "on top" of larger ones, they do not obscure each other. All hot spots are actually labels and relate to parts of the photo (not on blank space with filled in notes). One or more hot spots include a link to a relevant supporting resource on the internet. Minimum 7 hot spots. In focus or appropriately focused for effect. The subject of the picture occurs "naturally," it is not a contrived shot. Really makes the viewer "see" math in a place they hadn't realized it existed. (Example: trigonometry)
Level 3
Significant number of concepts/facts included. (Minimum 5 concepts/facts.) All hot spots accessible. Most hot spots are actually labels and relate to parts of the photo. Not more than one hot spot on blank space. One or more hot spots may include a link to a relevant supporting resource on the internet. Minimum 5 hot spots. In focus or appropriately focused for effect. The subject of the photo has been "set up" or contrived yet still illustrates math found in "the real world." (Example: derivative)
Level 2
Some effort to include content evident. (Minimum 3 concepts/facts.) Most hot spots accessible. Most hot spots are actually labels and relate to parts of the photo. More than one hot spot is on "blank" space. May or may not include links to relevant supporting resource on the internet. Minimum 3 hot spots. In focus or appropriately focused for effect. Although it is a "real world" picture, objects have been used to "draw" the math. An obviously contrived shot. (Example: trigonometry)
Level 1
Very scarce content related to assignment. Less than three hot spots are visible or have information related to the theme of the assignment. It is evident that little effort went into finding and shooting a picture that reflects the theme of the assignment.
Level 0
Content unrelated to theme of assignment. No hot spots or mostly unrelated to the theme of the assignment. Out of focus and/or otherwise difficult to look at.

Creativity (up to 5% bonus)

The maximum possible mark for this assignment is 105%. You can earn up to 5% bonus marks for being creative in the way you approach this assignment. This is not a rigidly defined category and is open to interpretation. You can earn this bonus if your work can be described in one or more of these ways:

  • unique and creative way of looking at the world, not something you'd usually think of;
  • original and expressive;
  • imaginative;
  • fresh and unusual;
  • a truly original approach.


Flickr Assignment Rubric - in progress

I wanted to capture our "work in progress" as we develop the flickr assignment rubric. Many of the comments that have been made are still contained in this doc. Reading it from top to bottom is not the order in which the comments were made; it's been done asynchronously over the last week. There have been significant changes to the document over this time that are not captured in this 11th hour snap shot of the collaboration. Students (and Lani and I) have been adding comments in different colours to distinguish different authours although this hasn't always been consistent. It may be hard to make out some of the coloured text against the background of the blog. I'm fascinated by the discussions the students have been having as they work through this. They have until tomorrow morning to finalize everything. I will republish the final rubric tomorrow when it's done.


Flickr Assignment Rubric

To All My Students
I've started putting together a rubric to grade your future flickr assignments. I'm opening this document to all of you to help build the rubric. So far I've included only 3 categories:
Tags (no or incorrect tags, no marks)
Mathematical Content (50% of total mark five point scale 0 to 4)
Photograph (what percent of the mark should it be worth? What are the descriptors for each level?)

Questions: What other categories should we have?
Should it be marked on a 5 point scale (0 to 4) or just "done" or "not done."
(Do you think having a category for photograph, and a separate one for hot spots would be of value? -Lani)


Feel free to add to this document and make whatever changes you like. Together we'll build a better assignment. ;-)

The Goals (Feel free to add to this.)

  • Learn to look at the world through mathematical eyes and see the math in everything, everywhere.
  • In the course of looking for the pictures and creating the annotated hot spots think about old material in a new way. Strengthen the mental links you have to concepts already learned. Make learning sticky.
  • Creating digital mind maps of old material. Each student contributes one to the pool. At exam time you can review all the annotated pictures in the pool made by yourselves and your classmates. Teach and learn from each other.
  • Build a permanent resource collection by creating a course specific set of real world "clip art." You can use the pictures in projects, assignments and blog posts. I will also be able to use them the next time I teach the course to benefit the next group of students. You will be teaching people you have never met.
  • Feel free to add more pictures that you think will benefit everybody in their studies.
  • Have fun with this! Maybe involve your families and friends in your learning like getting them to add their own pictures. You could post the pictures for them.


THE RUBRIC
Tags (1%) (Mr. K. says:
OK, you only want this to be worth 1%. But if the photo isn't properly tagged I can't find it and therefore cannot mark it. That's why I had this as "Improperly tagged = -100%" and no marks for proper tags. We need to have something here about proper tagging and me finding/marking the photo.) (Angry Chipmunk agrees)(Jefferson says: have it worth 5% so it wouldn't cost as much but significant enough to motivate the student to tag it properly) ( Oliver says: I agree with Jefferson, how about 4% though :) .. ) (i think that tags should be worth 10% so that students will really make sure that their tags are the correct tag for that assignment~ruschev)(we still have the same problem, if they are not tagged they can't be marked because they can't be found.)
-100% Tags are misspelled or no tags are present so therefore photo cannot be graded and will be given a ZERO. (i agree, if its not there or misspelled its impossible to find, and therefore is not handed in... this should be -100% ... sorry guys :P ~Lisa)

-tennyson 12/21/06 : well anyone can make a mistake on tags., so i think tag worth 1 percent is ok, but tag are pretty eazy,can u say easy mark, so it should be like alil bit more.

Tags should be worth 5- 10 percent. Why? For those who can't make a simple tag for their work, they should lose on this section. What is a piece of work if you don't tag it. An example,creating a theory and you do not put your name or credit yourself. It only takes about 10 seconds to label your work. anything below 5 percent is too low. Anything higher than 10 percentis too much for tag marks. ~Mark


[i think that a photo with an incorrect tag OR with no tag at all should be awarded ZERO and i think we should keep it that way. Why would someone want a -100%? Is it really necessary to give a negative mark to someone who did not label their flickr assignment? ~ zeph]

(I think you're right zeph, actually, what you said is what I meant. - Mr. K)


Mathematical Content (50%)
4- Packed with mathematical concepts/facts. (Lani wonders should there be a stated minimum number of mathematical concepts/facts?) (Jefferson says: half of me says yes because it will give students a required minimum to think of facts and concepts, the other half says no because one concept can relate to the entire photo "quality over quantity") ( Oliver says: I believe we should have a minimum mathematical concept/facts. )(Jefferson: if we were to minimal concepts, where would it fit in the rubric?) ( Oliver says: I believe there already is marks for minimal hot spots ) (this one looks good to me, I like how you've outlined how many are required for an ok mark.. that way we can all make sure we've got extra so that we can all get exceptional marks like i know we can :D)
3- Significant number of concepts/facts included.
2- Some effort to include content evident. (minimum of 3 hot spots with mathematical concepts/facts)
1- Very scarce content related to assignment.
0- Content unrelated to theme of assignment.

Hot Spots (30%)

4- , all hot spots accessible (not covered by other hot spots), all hot spots are actually labels and relate to parts of the photo (not on blank space to just fill in notes). (Lani wonders about "(not covered by other hot spots)"; I viewed one assignment which was exceptional where the hot spots overlapped. Is that the same as covered?) (no, I meant where hot spots "cover" each other in such a way so that the spot underneath cannot be accessed -- imagine a large square on top of, covering, a small one. -- Mr. K. ;-) )
3- Hot spots work to a certain degree, and less information in each hot spot. Most of the hot spots are visible and are easily accessed.
2- At least 50% of hot spots are working and are fairly easily seen.
1- Some hot spots are visible and only some of the hot spots have unrelated info (Ben:is this good?)The hot spots always work, the real question is are they ... appropriate(?)/accessible(?)/relevant(?) or not.
0- No hot spots or mostly unrelated to the theme of the assignment. ( Oliver says: Photograph section is good to go. =).. )

[yes, i agree with oliver. the hot spots section is ready to go... ~zeph]

-tennyson 12/21/06 : what if it was a mistake on one of the hotspot that you forgot to put, or it was too late to put it. at least get some marks.

[i'm sorry but according to mr.k, "LATENESS IS NOT ACCEPTABLE!!!" so if they forgot to put a hot spot or forgot to finish it, or wanted to make a late change, well TOO BAD! it cannot be part of the mark. mr.k gives ppl a reasonable amount of time (a huge chunk of time) to finish a certain assignment. if they cant finish in time, then they have to manage their time more wisely. they have to learn to manage their time more wisely cuz they'll be needing that skilll when they are adults. well they can re-edit their flickr assignment but it wont be part of their mark. after all, this assignment is also intended to review for the exam. ~zeph]

Maybe we should have a "hot spot" category? One student included a link to other resources on the net in one of their hot spots. I thought that was a "higher level" use of hot spots. The link was to a song to help remember the quadratic formula so it was mathematically relevant as well as a creative use of the hot spot. - dkuropatwa 12/18/06, 8:47am


Photograph (10%)I'm wondering here if this should be about technical aspects of the photo or content of the photo or both? Is one more important? -Lanihall 12/20/06, 10:09pm

4- In focus or appropriately focused for effect. Really makes the viewer "see" math in a place they hadn't realized it existed ...( I agree with this. There should be a purpose with the effect of the picture

3- -tennyson 12/21/06 : Well The picture quality shouldn't be alot of marks because some of us only have camera phones.And some people dont carry their camrea 24-7. Like example ,i found a picture in the class , at the time i didnt have a camrea around , but i only had my camera phone.But i agree with the in focus effect tho.

2-

1-

0- Out of focus and/or otherwise difficult to look at(?) ...

[maybe the photograph section should be more of a "done" or "not done" kind of thing cuz: how can you grade a photo? the photo all depends on what the student is thinking and their creativity. ~zeph]


Creativity (10%)I like the thinking behind this category but it still needs some fleshing out. Should the category have levels (0-4, I'll calculate the appropriate "percentage") or should it be the way it's begun to take shape below? I also thought Ruschev's comment about the weighting was an important one. Anyone else want to weigh in on this? -dkuropatwa 12/18/06, 8:50am


10%- Highly creative (photo used was unique) (how about making Creativity 5% and put 5% more in Photograph or in Mathematical Content..because some of us aren't that creative..just to be fair ^_^ hehe~ruschev) (I think that there should be something special about the homework to get a full mark. I think that adding a link or a song will help solidify someones homework-----m@rk) I AGREE ...Natnael The whole point of the assignment was to look at everything in a new way... you don't have to be "creative" to find a good picture, you just have to be willing to have an open mind and see the math in everyday life!! If the person has taken the time to find something that is actually relevant, and unique (as in no other person has seen that math in that object) than their creativity mark should be good.. you see this mark is more about trying than putting pressure on yourself to be "creative"... and who knows maybe when you're just trying to look at things differently you'll end up being creative. I say keep creativity at 10% it gives people a reason to try to find something unique and interesting-- and we all know that that is where the fun is :D


[i agree with the purple-worded guy cuz the point of this assignment is to have fun AND to review for the exam. maybe creativity should just be like a mark out of 2 or 3? or something that's worth a small amount of our flickr assignment cuz being creative is a gift and for sum ppl, their level of creativity is... well..not as great as compared to other ppl. maybe awarding the person some bonus marks for an outstanding creativity is a good idea. THIS IS A MATH CLASS NOT A CREATIVE ART CLASS!!! ~zeph]

[i believe creativity should be on a scale that Mr.K suggested, such as from 0 to 3 whereas 1 is awared to the ppl who has a flickr assignment that obviously states "I dont care about this assignment"; 2 for ppl who are in the "middle" that m@rk suggested, and 3 for the "top-notch" ppl and who are creative with their assignment. awarding someone a 4 or 5 in this portion of the assignment (bonus marks) are for ppl who have an awesome "over the top" flickr assignment and make the whole class say "wow! i would've never thought of that!" ~zeph]

5%- Some degree of creativeness.( i think that this for a homework that is not so special. What i mean is a homework that is just usual to see)
0%- Unrelated Content and photo. (i think that this is for a homework that has no link or content whatsoever with the picture)

-tennyson 12/21/06 : what if other people see the photo that it does related. Like at least get some marks from it.

Bonus:
+2%- unique and creative ways of looking at a photo, concept wise, nothing obvious) ( not one you'd usually think of.. etc)


Just So Cool! (Rubric Revisions)

This is just so cool I had to share it!


I just got a comment from Bud on my previous post asking if he could see the rubric my students are working on. I said yes and invited anyone else who wants to see what's going on to email me and let me know if you want to watch. I can invite you as an observer or collaborator. I'm pretty free with letting folks observe as the students craft their assessment rubric. (It's such a fascinating process to watch!) Collaborators are welcome as well in the context of mentors. (I'm using the same criteria here as I do for mentors to my class blogs.)


Right after replying to Bud's comment I decided to drop in and see if the doc has seen any action ... boy! Has it ever! TIME really hit the nail on the head ... if only they'd do a focus issue on the new context of education, I think my students should be on the cover ... but then, I'm biased. ;-)


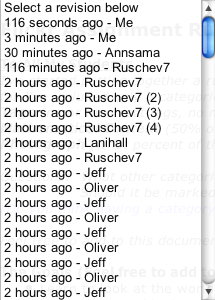
Look at the revision log ...


Flickring Assessment


I'm not entirely happy with the results of my students flickr assignments. Some of them are simply breathtaking, others, well ... not so much.


Over the last week or so we've been talking about the need to have a rubric to guide the students in their work and to fairly recognize when someone does really great work and when they don't. I was thinking that I'd put together an outline of a rubric and then we could discuss it in my classes; try to come to some sort of consensus that provides a "picture" of success and rewards effort appropriately.


As I was marking some the assignments tonight I created a new google doc and started taking notes on what I would like to include in the rubric. Then I saw the [Collaborate] button ... hmmm ... (Google Docs allows you to invite people to your documents/spreadsheets and make changes together in real time, online, through your web browser.)


I decided that sharing the doc with every one of my students would be a better way to do it. I started it, now I'm going to let my students take the lead. I've included Lani in the group because I feel she's an important part of our class community (she's been mentoring all my classes since September). I told her she should feel free to sit back and watch or chime in with her own 2 cents. Whatever she's most comfortable with.


There are approximately 50 people working on this document as of 20 minutes ago.


This is going to be fun to watch. ;-)

Flickring Mind Maps ... making learning sticky

Four ideas came together:


  • (1) A month ago, over at The Fischbowl, I read a post called A Math Teacher's Experience about using cell phones to motivate a lesson in mathematics.

  • (2) Alan Levine's flickr section of his K12 Online keynote presentation.

  • (3) I've been rereading Coming of Age and read Terry Freedman's using flickr as clip art article.

  • (4) One of the posts that I have been trying to write and struggling with the words is about the idea that new tools should foster new pedagogies: What can I do now with web 2.0 tools that I couldn't do before?


All my classes are making custom clip art collections ... actually, it's grown into a sort of flickr mind map and review of material that has already been taught. Here's what we're up to ...


Two weeks ago I introduced all my classes to flickr and asked them to sign up for (free) accounts.


Assignment 1 (acclimatisation), Time Frame - one week: Take a picture of your favourite number using your cell phone or digital camera. Upload it to flickr and tag it with a unique tag for each class. Also tag it with the assignment tag: interesting. You cannot copy pictures off the internet but you can "set up the shot" in any way you like. Include a description of why the number you chose is interesting to you. Be creative and have fun with this.


The purpose of this assignment was just to get them used to the mechanics of using flickr. During the week they were working on their first photo assignments I posted this to each of the class blogs (illustrating what success looks like):


This picture shows that 7 x 7 = 49 ... click on it to find out how. ;-)


Don't forget about your flickr assignment.


Cheers!

Mr. K.


This was to expose them to the idea of creating "hot spots" on their pictures. As pictures began to come up in public searches on flickr for each of the unique course tags, I created a flickr badge (you'll have to "sign in" to follow that link) for each class. I put it in each blog's sidebar under the heading "Our Math Photo Gallery." The engine behind the badges is the RSS feed associated with each unique course tag. Flickr generates these RSS feeds automatically.


Assignment 2 (concise digital review and content creation), Time Frame - one week: We're about halfway through the semester. Each class was given a topic or unit we had studied together; Pre-Cal 30S: quadratic functions; Pre-Cal 40S: trigonometry; AP Calculus AB: derivatives. They have to take a picture of something in the real world that is connected to these ideas. The picture can be "set up", but it has to be a real photograph taken by the students themselves. Screen shots and pictures of something written down don't count ... it has to be a "real world" picture. Once they have taken and uploaded the picture they have to fill in as many hot spots on the picture as they can illustrating concepts related to the topic they were given.


The Goals: They will have at least two more assignments like this last one ...


  • »They are learning to look at the world through mathematical eyes and see the math in everything, everywhere. Those with cell phone cameras are walking around thinking about and looking for math everywhere they go.

  • »In the course of looking for the pictures and creating the annotated hot spots they will be thinking about the material covered in a new way and strengthening the mental links to the concepts they have learned. I hope to make their learning sticky.

  • »They are creating digital mind maps of the material we learned way back at the beginning of the semester. Each student contributes one to the pool. At exam time they can review all the annotated pictures in the pool made by themselves and their classmates. They will be teaching and learning from each other.

  • »They are creating a course specific set of real world "clip art." They can use the pictures in projects, assignments and blog posts. I will also be able to use them the next time I teach the course to benefit the next group of students. They will be teaching people they have never met. They are also building a permanent resource collection.

  • »They are having fun with this. So am I watching it unfold. They are talking to other students and teachers in the building about this. A buzz is growing. Can you imagine the conversations they are having at home? They are involving their families and friends in their learning.


Some Snags


There were two snags.


First, most kids just uploaded a single picture to flickr. It didn't show up in the tag search. When a new account is created on flickr a real live human being examines the pictures in the account to ensure that they are real photos and not clip art, screen captures, etc. If they are real pictures, the public photos in the account are added to the pool of pictures in flickr searches and RSS feeds. However, there must be a minimum of 5 public pictures in the account in order to start this review process.


Second, they found my flickr account and saw pictures of me. I had told them to never upload pictures of themselves to the internet. When they saw that I have pictures of myself online a couple of them figured it would be alright to upload pictures of themselves as well. (That really drove home a lesson to me about modeling.) In some cases, the inclusion of pictures of themselves was an honest oversight. We discussed the fact that teachers and students are different. I also explained how I came to have pictures of myself online: the photos are used in publications or conference announcements that I am a part of; they are part of my professional life. In our student-teacher relationship I am very careful to protect their identities. As we have discussed in class many times, their anonymity as students is important. We do not do anything that connects their images to their names. This was an important lesson for them (and me). Because of the school division's proxy server filter we cannot do this sort of assignment at school. In a computer lab I can monitor my students closely. We could have addressed this issue when it came up immediately. If the school division didn't have a filter this project could have started more safely. All students that had uploaded pictures of themselves have removed them. We are only taking pictures of things, not people. If a picture is of a person, their face is obscured. Most students are using aliases as their flickr user names, others are using first names only.


Assessment


A very close, granular assessment of this sort of assignment would undermine the pedagogical goals. I expect a lot of deep learning to come out of this. This assignment is being marked for completion only; if it's done they get 100%, if not they get 0%. In thinking about using new tools effectively I also do not want to make mine or my students workload heavier. I characterize this as assessment for learning. This includes the time and effort required for assessment. The badge on each class blog picks up the pictures as they are uploaded. Also, a quick search in flickr, by course tags (pc30sf06, pc40sf06, apcalc06), brings up all the related students work instantly. Marking is a breeze.


The Results


The "real" assignments (the mind maps) are due on Monday, December 4. The Pre-Cal 30S class assignments are due on Wednesday, December 6 (they have a large project due on Monday). I'm looking forward to seeing what they come up with.


Check out the flickr badges in the side bar of each class blog:

Pre-Cal 30S (Fall '06)

Pre-Cal 40S (Fall '06)

AP Calculus AB (2006-07)


I couldn't do any of this before RSS, tagging, linking and of course, flickr. ;-)